

A new study analyzing publicly available data tells us that organic farming lowers dietary risks of exposure to pesticides.
A new study analyzing publicly available data tells us that organic farming lowers dietary risks of exposure to pesticides. Though these data aren’t surprising, the study creates a new concept called a dietary risk index, or DRI. This is an important contribution for both researchers and consumers. DRI provides new data analyses for researchers interested in pesticides and dietary exposures, and includes information that could help consumers understand how much pesticide exposure they’re at risk for when they consume specific foods.
Thorough pesticide use data that’s publicly available is hard to come by. The US Department of Agriculture (USDA) surveys pesticide use, but not on every single crop. EPA’s pesticide use reports are few and far between, and don’t give details on which crops they’re used on — though they do report how much pesticide is used on farms. Another way to look at US pesticide use is via the US Geological Survey model that maps estimates of commonly used pesticides based. This paper uses all available sources to analyze 2019 pesticide use intensity in conventionally produced crops compared to organically produced crops in the U.S.
The authors have several decades of expertise on pesticide research between them (and one of the authors used to be a PAN scientist!). She created the Drift Catcher and the Drift Catcher community monitoring program while at PAN. The Drift Catcher is an air monitoring device that PAN uses with community partners to detect pesticide drift and has been used in support of local or state-based policy projects.
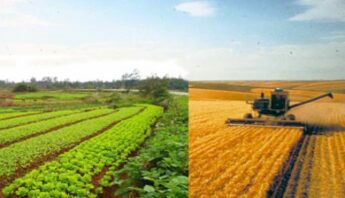
Pesticide use: conventional vs. organic crops
The study found that pesticide use overall (including herbicides, insecticides, and fungicides) on conventional crops is most intensive on specialty crops like fruits and nuts. The crop that had the greatest number of insecticides applied on average was lettuce, at 6.1 active ingredients on average, followed by strawberries at 5.9 active ingredients. Vegetables had a higher (2.1 kg/hectare) rate of use for fungicides than other types of crops. Further, the study highlighted that herbicide use is more prominent on row crops like corn.
Organic farmers may opt to use organic-approved pesticides. These pesticides are generally of a lower toxicity than those used in conventional production. Active ingredients such as aliphatic petroleum oils (neem oil), pheromones (used to disrupt pests’ mating), kaolin clay, and sulfur, are used on organic farms. To achieve organic certification, the farmer must submit a plan that describes practices the farmer intends to use, how they will monitor for pests, and the pesticides they would use if their preventive strategies do not work. A USDA accredited agent reviews and approves this plan, including the specific products proposed for use.
While the pesticide industry loves to promote the idea that “organic farming uses pesticides too,” this is a total misrepresentation of the process. Organic farmers use management tactics coupled with non-synthetic chemical controls when other practices fail. Conventional farms simply use pesticides to manage their systems.
An example? The authors looked at tomatoes using California’s detailed pesticide use data, focusing on tomatoes grown in Yolo County, California. The biggest difference between organic and conventional tomatoes was in herbicide use. Organic tomatoes had 0.02% of hectares planted treated with herbicide, while each hectare of conventional tomatoes received an average of just under 2.5 herbicide treatments per hectare. This is a herbicide rate that is 12,500 times higher than the rate applied to similar, certified organic, tomato crops.
It is notable that the paper indicated that use rates of organic-approved fungicides are higher than use of fungicides in conventional farming. However, organic-approved fungicides like copper oxide or hydrogen peroxide are less toxic than mancozeb or chlorothalonil (the latter of which PAN has found in air sampling near Minnesota potato fields). Drift-prone chlorothalonil was determined to be “likely carcinogenic” by US EPA, and is also listed as a Prop 65 carcinogen in California.
So what’s the dietary risk index?
This study pools data to create a new concept called a dietary risk index (DRI). DRI is a little complicated if you’re not a pesticide geek, so bear with me!
To quote the paper,
“A DRI value is an index that is calculated as the ratio of a pesticide’s presence in a single serving of food, divided by the maximum level of the pesticide that can be present in the food without triggering the US EPA’s ‘level of concern…’”
Basically, higher DRI numbers indicate a higher likelihood the food you’re eating has a specific pesticide in it. That means your dietary risk, when you eat this food, is higher. A DRI-Mean value of 0.5 or above triggers an EPA level of concern. A DRI-Mean value of 1 or more for a single pesticide-food combination tells us that one serving of that food also means you’re ingesting the maximum amount of that pesticide allowed by EPA for the day.
For example, frozen strawberries have an average of 10.3 residues per sample, with a DRI-Mean (it’s an average of all the samples tested for residues) of 6.7. This rating well exceeds an EPA level of concern for dietary risk.
What do we mean by “level of concern?”
Pesticides have certain allowable levels (determined by EPA risk assessments on individual pesticides) in our foods. A long-term, daily exposure to a given pesticide, is called a “chronic reference dose.” Sometimes uncertainty factors are used in a calculation in addition to these chronic doses, which reduces the allowable amount due to scientific uncertainty (EPA insists on calling these “safety factors”). The uncertainty factors are applied to the chronic reference dose, making a chronic Population Adjusted Dose.
If the Population Adjusted Dose is exceeded in the diet, then the level of concern is exceeded, which isn’t a good thing. While exceeding these doses doesn’t mean you’re poisoned, it does mean that you’ve reached a chronic exposure at a concerning level, according to the EPA.
Three ways to calculate DRI
Are you still willing to geek out on pesticides? Read on.
DRI values are calculated using pesticide residue sampling by the USDA’s Pesticide Data Program and the UK’s Pesticide Residues in Food program, as well as EPA dietary risk levels. DRI values are calculated for:
individual samples based on all pesticides found in the sample (Sample DRI);
food-pesticide risks based on the average residue level (DRI-Mean); and
food-pesticide risks based on average residue levels and frequency in the food supply (FS-DRI).
All of these are of interest — perhaps for the average person, the FS-DRI is most interesting because most people are getting chronic exposures via food. The FS-DRI index also includes the frequency with which these pesticides are found. You can read more about DRI in the paper, and you can also read more about its limitations and a way to look up foods here.
Among the foods with the most concerning DRI values across the board? Frozen strawberries. Frozen spinach is also concerning to me.
Do we have to think about this?
Even a pesticide geek can get kind of burned out on this. After looking at this paper, I find myself very glad that I can access an organic community supported agriculture farm share at a pretty decent price, which makes my life a little easier. But that’s a kind of no-brainer question. I, along with many people, prefer not to have 10.3 average pesticide residues per sample of my frozen strawberries, so I’m going to vote with my dollars wherever I can and hope that our advocacy work reduces reliance on pesticides.